
Imagine you are presented with the following opportunity: An Olympic-sized swimming pool is filled with plastic Easter eggs, around 64,000 of them. Most eggs contain nothing, but a small number (2.4%) include $100 dollar bills. If you were allowed to select 100 of the eggs randomly, how do you think you would fare?
The odds are not in your favor. There’s a high probability you’d end up with a pile of empty plastic eggs.
We’re using this example to highlight a fascinating new study on investing. In short, analysts studied investor returns over the thirty years from January 1990 through December 2020. Their study analyzed 64,000 global common stocks in 42 markets around the world. What did they find?
Focusing on aggregate shareholder outcomes, we find that the top-performing 2.4% of firms account for all of the $75.7 trillion in net global stock market wealth creation from 1990 to December 2020.1
That’s right. A tiny number of stocks generated 100% of the returns available to be collected in the global stock markets. Further, their study revealed that more than half of all stocks failed to beat the return of 30-day U.S. Treasury bills over the period. In the U.S., more than 55% underperformed. Outside the U.S., it was worse, with 57% of stocks underperforming Treasury bills.
Translation: Between January 1990 and December 2020, more than half of global stocks earned a compound return lower than U.S. T-bills.
Ironically, having a small number of stocks deliver the majority of returns each year isn’t unusual. Through June 30th of this year, the S&P 500 was up 14.1%. 83% of that return was due to just seven technology stocks: Apple, Microsoft, Amazon, Nvidia, Tesla, Facebook, and Google.
The implications for this are straightforward: Selecting individual stocks to try and outperform the markets is akin to playing a pernicious casino game. The odds that an individual could consistently select the winners each year are not zero, but they are close. By contrast, the odds of winning at Blackjack are 42%. If you’re seeking a sound approach to investing, we wouldn’t recommend either pursuit.
What about hiring professional managers on Wall Street to select stocks for you? If one believes their marketing hype, superior research capabilities, and market insight can deliver outstanding results over time. Nope. It turns out that it’s incredibly difficult for anyone to “outperform” the market over any reasonable period. The chart below reflects the percentage of actively managed investment funds that outperformed their respective benchmark over the 20 years ending 12/31/2022:
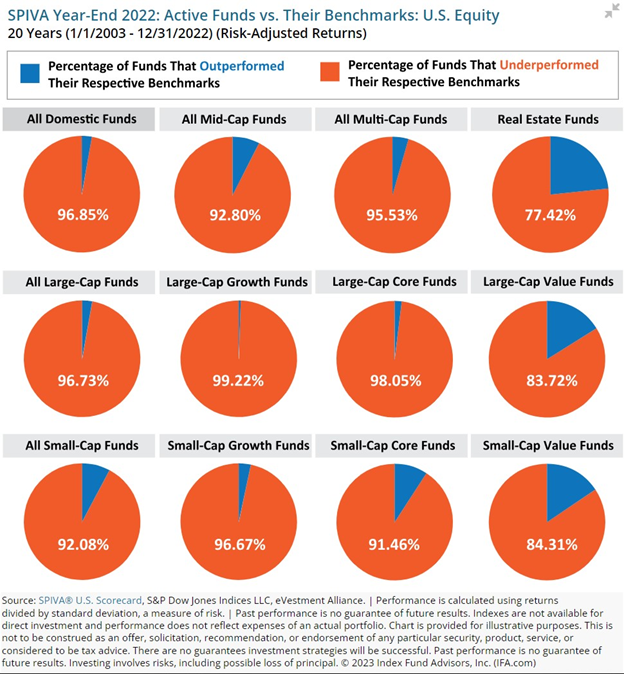
Let’s say you’re trying to decide which active manager or broker to hire to help you outperform the markets over time. What are the odds you could pick a manager in the tiny blue slivers above? There’s a much higher probability you’d select a manager who underperformed the market itself.
It would seem the game is rigged. If individuals cannot consistently pick the winners, and Wall Street’s record is not much better, what’s an investor to do?
The answer is simple. Own the entire market of stocks in one basket via an index fund.
Over the same thirty-year period as the study, an investor who bought an index fund tracking the S&P 500 would have achieved an average annual return of approximately 10.5%.2 By owning the basket of available stocks, you are assured of owning the winners, even if you own the losers. Fortunately, history demonstrates how the winners far outpace the losers. A rising tide, as they say, floats all boats.
The upshot is your investment would have more than quadrupled during the period by automatically owning the small percentage of winners with no stock picking required.
The idea of passively owning the markets in total isn’t new. Beginning with the first index fund in 1976, the index marketplace has grown to represent between a quarter and a third of US market capitalization. More than $7 trillion resides in index funds tracking the S&P 500 alone.3 As a bonus, index funds tend to be far less expensive to own than actively managed mutual funds.
We are quick to note that simply owning one market index alone likely presents too much volatility for the average investor, and it doesn’t guarantee you won’t see your account value decline in years such as 2022. (Keeping with our theme, you’re still putting all your eggs in one basket. Ahem.) The key to a successful strategy is to diversify by owning various index funds (large stocks, small stocks, real estate, bonds, commodities, etc.) in varying amounts to create a ride you can stand through all the market’s gyrations.
If you’d like to review your current investment strategy or learn more about how we use index funds, don’t hesitate to give us a call.
Your First Coast Wealth Advisors Team
1 “Long-term shareholder returns: Evidence from 64,000 global stocks” Hendrik Bessembinder, Te-Feng Chen, Goeun Choi, K.C. John Wei
2 yCharts. S&P 500 returns from 1/1/1990-12/31/2020. The S&P 500 index is an unmanaged portfolio and individuals cannot invest directly in the index.
3 S&P Dow Jones Indices