

With the passing of the halfway point for the year, we would like to provide you with an update on the financial markets along with other notable topics we’re following.
Financial Markets
The S&P 500’s all-time price value (not including dividends) peaked on January 2nd, 2022. By October 11th, the index had declined 24.7 percent. It turns out that happened to be the day the market started its recovery. Here we are in the third week of June, and the index is up 22.9 percent off its low. We’re not quite back to even, but we certainly seem to be fulfilling the message we’ve shared with you all year long. When markets decline as much as they did last year, they typically experience a full recovery within a year of their bottom.
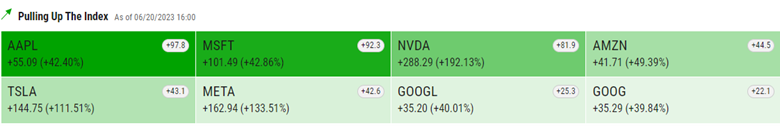
The recovery in stocks has been a bit one-sided since mid-March. Seven companies represent nearly 1/3rd of the entire S&P 500 index. Their collective performance is responsible for the majority of this year’s progress. If you were to remove them from the equation, the stock market would only be up by a few points this year. The 7 companies are Apple, Microsoft, Amazon, Alphabet (Google), Tesla, Nvidia, and Meta (Facebook).
Small company stocks, as measured by the Russell 2000 index, have not experienced the same recovery as their larger stock cousins. Whereas the S&P 500 price index is up nearly 16 percent year-to-date, small companies are only up about 6 percent.
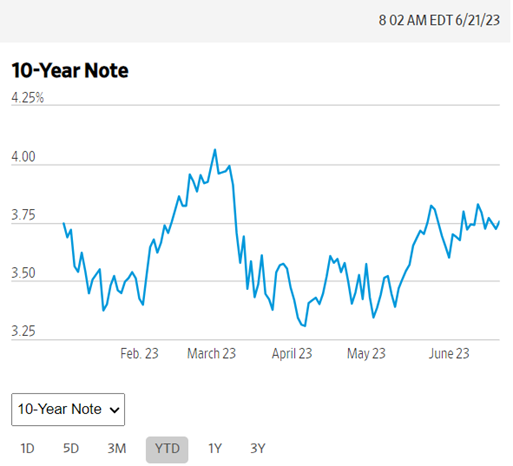
Bonds, as measured by the yield on U.S Treasuries with 10 years until maturity, are showing signs of stabilizing. They began the year yielding about 3.75%, and that’s where they sit today. If this relative stability persists through the remainder of the year, we wouldn’t be surprised if bond funds ended the year with an annual return close to this.
Side note – the yield on a 10-year Treasury bond has historically been a good approximation of the annualized return of the bond market in the decade ahead. On January 2, 2013, U.S. Treasuries were yielding 1.9 percent. The annualized return of the iShares Core US Aggregate Bond ETF (AGG), an ETF that tracks the U.S. bond market, over the past ten years is 1.5 percent.
Federal Reserve Interest Rate Policies
The primary influences of the financial markets over the past 18 months have been the direction of interest rates and corporate profits. The Federal Reserve, which is tasked with maintaining price stability and maximum employment in the economy, spent all of last year hiking rates to 40-year historical levels. They decided to keep rates in the 5.0% – 5.25% range at their recent June meeting but left the door open to additional hikes over the remainder of the year.
Since their liftoff in March of last year, the Fed has communicated that they expect interest rates will “remain higher for longer.” The financial markets eschewed this message – until recently. They are finally coming to terms with the likely reality that interest rates will remain at their current level well into next year.
The takeaway – the interest rates we’re seeing in high-yield savings accounts, money market mutual funds, and other short-term interest-bearing investments are likely to be sticky and with us for a while. That’s good news for savers and investors.
Corporate Profits
For much of the first half of the year, Wall Street analysts were predicting that corporate profits would be materially lower this year compared to last year. However, profits have remained remarkably resilient. Despite price and wage inflation, and higher borrowing costs, profits for the S&P 500 are still about 30% higher than their pre-Covid level. We are about to enter “earnings season,” the period following each quarter when companies report their financial results. We’ll see if the trend of better-than-expected results continues.
Recession Risks
Finally, I will close with a look at a few of the recession warning signs we track. The financial media continue to shake their fists in the face of a relatively strong economy to stoke fears of an impending recession. As the saying goes, “A broken clock is still right twice a day.”
GDP Growth: running at about 1% annualized growth (after accounting for inflation).
Unemployment Rate: 3.7% as of May and consistent with the average over the past 9 months.
Jobs per Unemployed Worker: 1.8 jobs for every unemployed person. Still very high.
Wage Growth: 6% as of May. Still very high.
Oil Prices: 20% lower than a year ago.
Inflation Rate: CPI at 4.1%, down from 9% last September.
The above metrics point to a vibrant economy. One thing not included in that list we’re also watching is the impact of the resumption of student loan payments beginning on October 1st. Some economists estimate that between $10 and $15 billion dollars PER MONTH will go toward the repayment of student loans. That’s money that will no longer be spent in the economy.
Our Next Webinar
Be sure to mark your calendars for our next webinar on August 3rd at 12 pm, where we’ll be discussing our thoughts on the markets and new financial planning tools we’re bringing to clients. Be sure to register for the webinar. A recording will be available if you can’t attend the live event.
Sources for the graphics included in this article are courtesy of ycharts.com and the Wall Street Journal. The S&P 500 index and the Russell 2000 index are unmanaged portfolios, and individuals cannot invest directly in the indexes.