

What is going on with the markets?
It’s been a long time since we’ve experienced a typical bear market. As of May 12th, the S&P 500i, an index of the largest public companies in America, is down 21 percent from its January 3rd high. Bonds are making matters worse by trading lower due to increasing interest rates. Unlike the Covid experience of 2020, which was swift and bounced back quickly, this drawdown has been a slow grind lower over the past five months—like someone dragging their fingernails down a chalkboard.
The pullback in stocks has been more pervasive than we imagined. While we expected the market to react to the Federal Reserve’s course change regarding interest rates, we did not expect the geopolitical issues to persist as long as they have. The war in Europe is threatening to pull the continent into a recession. So long as China continues to shut down cities with millions of residents because of one positive Covid test, the global supply chain will continue to falter. All three of these topics could contribute to global growth slowing this year. The financial markets are trying to price in all of the uncertainty surrounding these issues. Until it gets clarity, the market will behave like a manic-depressive.
There is some good news out there.
The markets have come to terms with what the Federal Reserve is doing with interest rates. Market participants appear to be taking the Fed at its word and assuming short-term interest rates will end the year in the 2.5 to 3 percent range. If that’s the case, the sell-off in bonds should be behind us, and we can start recovering some of the drops with the collection of coupon payments over the remainder of the year.
Inflation may be peaking. The May 11th inflation report was not as good as we hoped, but it wasn’t as bad as the previous month. Inflation over the past year came in at 8.2 percent, down from 8.6 percent the month prior. You can thank stable (relatively) gas prices and declining used car prices (from their peak) for the slight decline.
The bond market believes corporate profits are good enough to continue supporting the repayment of company debt. Bond investors are generally acknowledged as being “smarter” than stock investors because they are fixated on company financials. When you lend a company money, you care about cash flow because you want to make sure you get paid. The bond market is not signaling any weakness in Corporate America’s ability to make its debt payments.
Unemployment sits at 3.6 percent. This is as good as it was before the pandemic. There are 1.8 jobs for every unemployed person. Wages have risen more than 5 percent over the past twelve months, partly offsetting the effects of inflation on workers. Companies continue to fight for talent and are willing to pay up for it. The tightness of the workforce means the economy should be able to absorb the first leg of a slowdown if one materializes.
How bad can it get?
While it’s impossible to know how long it will be before the markets start their recovery, there are two things we can do to set our expectations. First, we can acknowledge that every downturn that has come before has ultimately been followed by a rebounded. And second, we can look to history to form an opinion on what to expect.
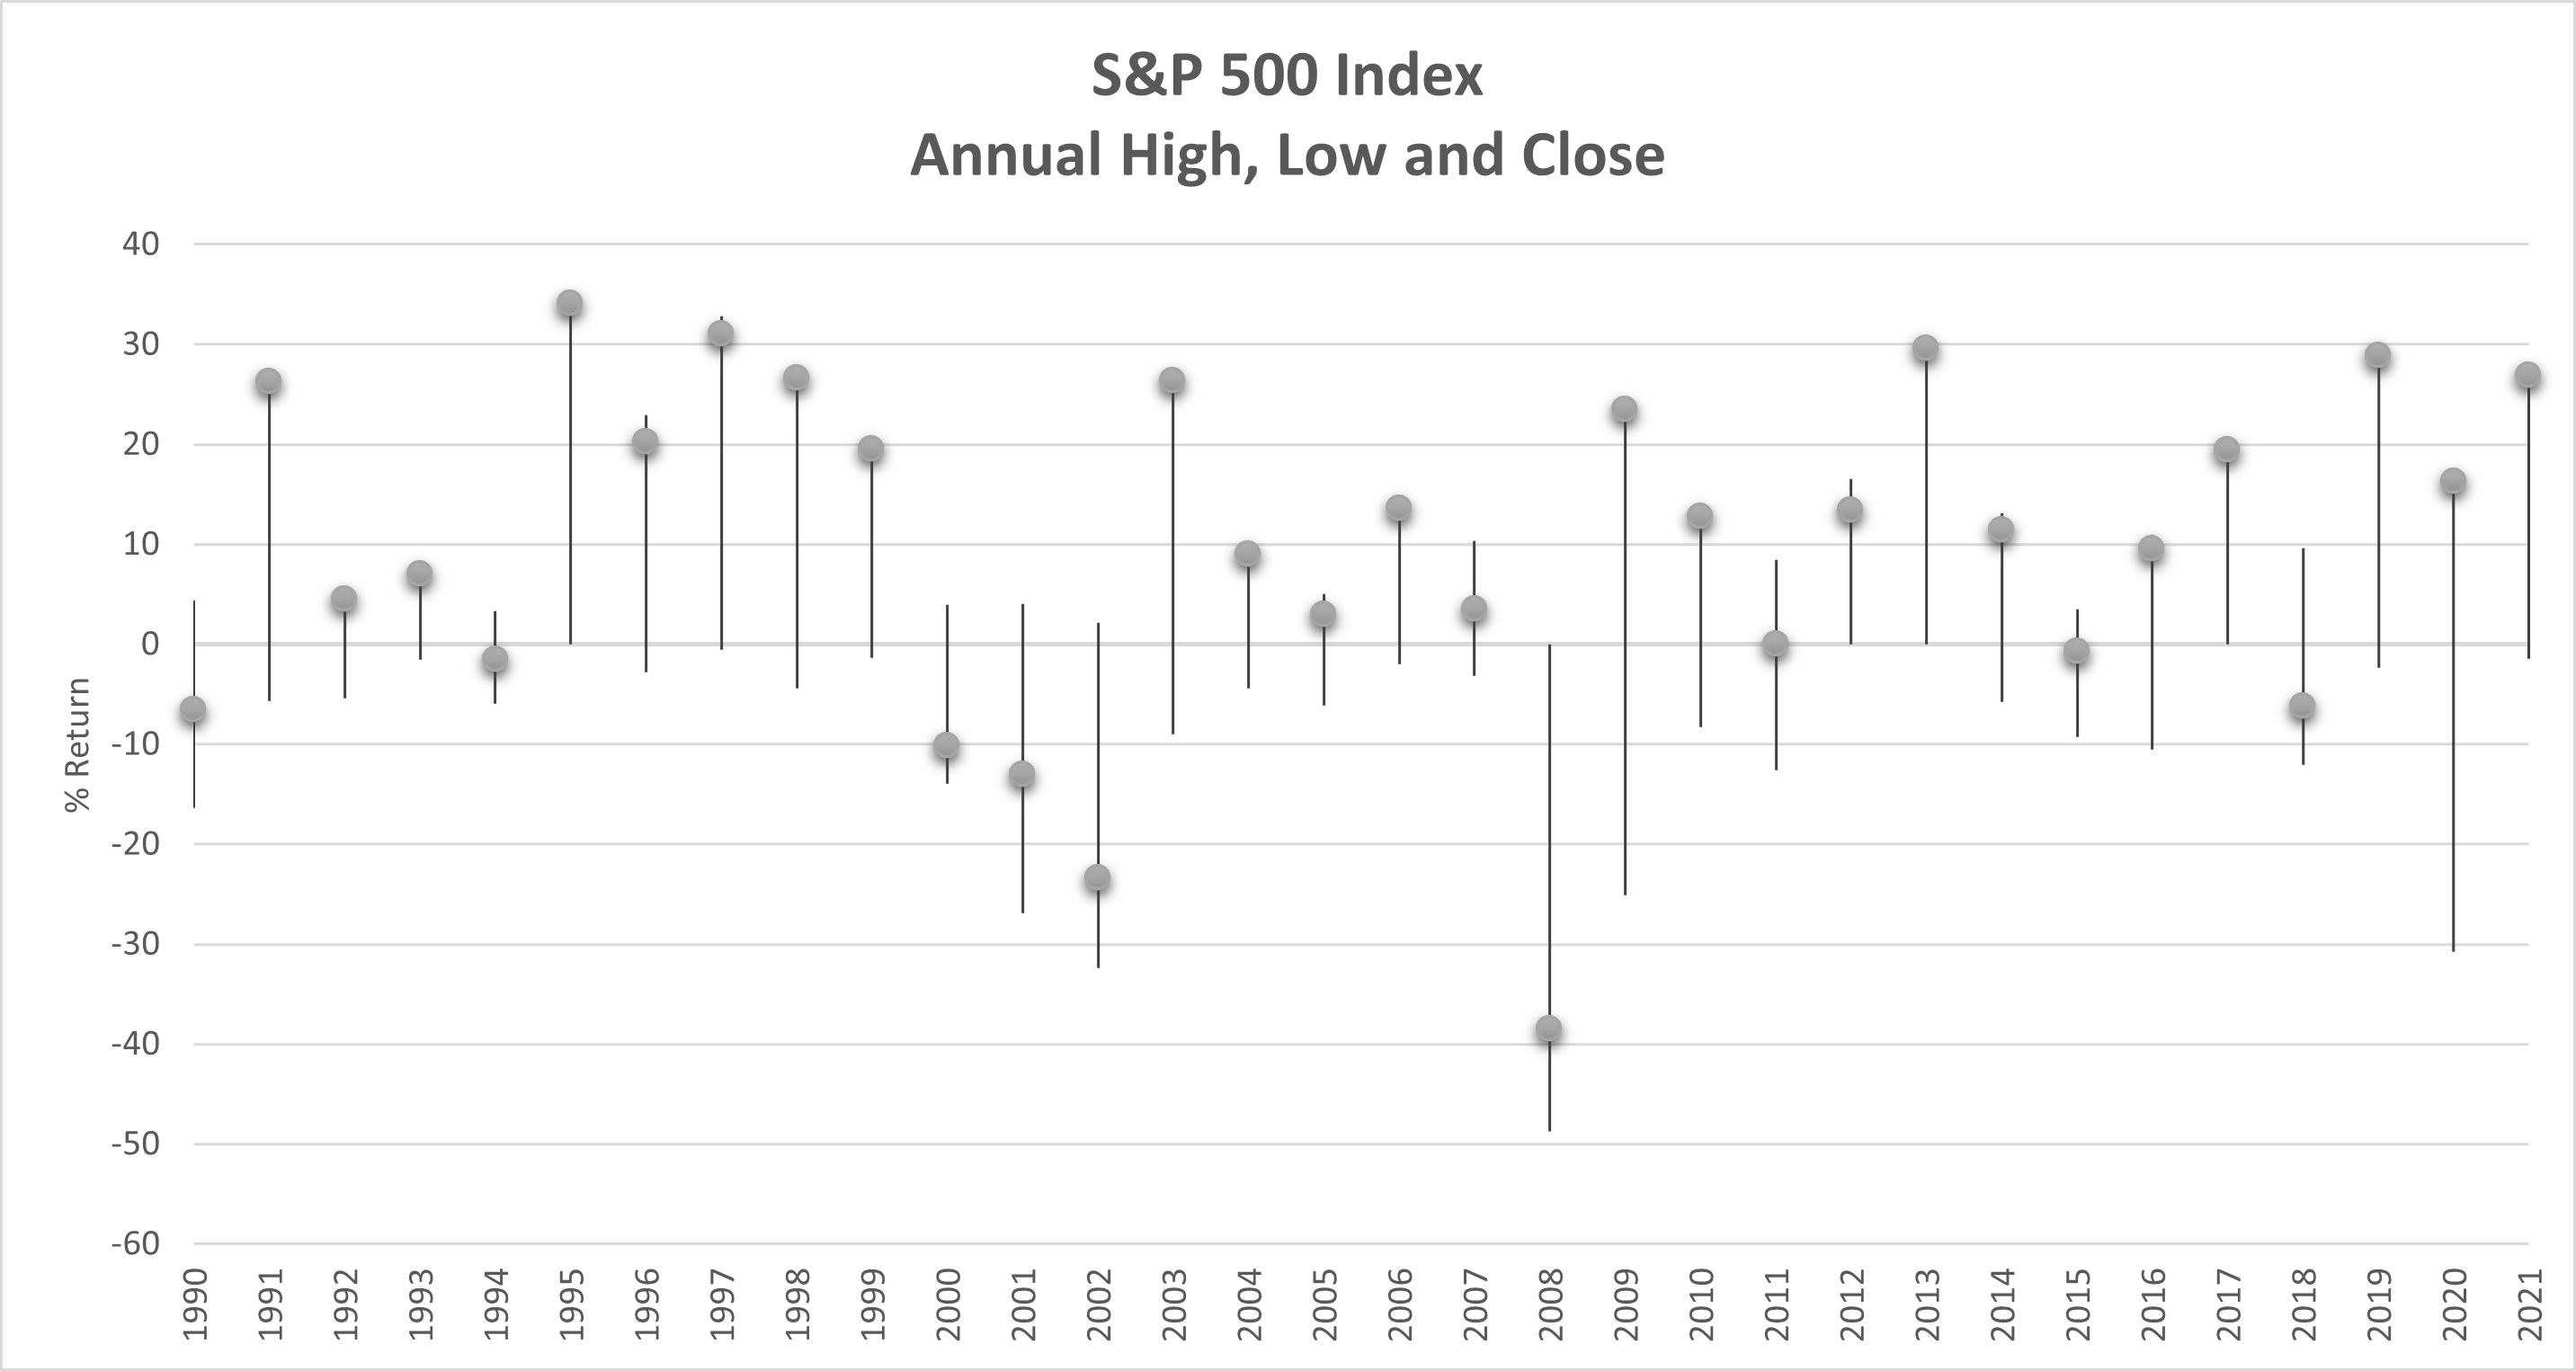
It’s not unusual for the S&P 500 index to experience a negative return in a given year. Looking back to 1990, 29 of the last 32 years experienced a temporary decline. Only 8 of those years finished in negative territory. The average drawdown was 9.7 percent. Being down 21 percent starts to signify something unusual is underway, and we’re not there.
In years when the drawdown was worse than 9.7 percent, they ended with an average return of negative 4.9 percent. Therefore, we should expect U.S. stocks to end this year down about 5 percent. That is lower than our previous estimate of ending the year with a slightly modest positive return.
Excluding the tech bubble bursting (2000 to 2002), the average return for the calendar year following a negative experience was a positive 24.5 percent.
Looking at intra-year performance is one way to frame expectations. Another is to look at how a typical, diversified portfolio has done when it has endured a negative period. We’ll use rolling annual returns instead of calendar year returns to broaden the sample of data.
A traditional moderate growth allocation consists of 60 percent stocks and 40 percent bonds. For this analysis, I created a hypothetical allocation consisting of 45% U.S. stocks, 15% international stocks, and 40% investment grade bonds.ii
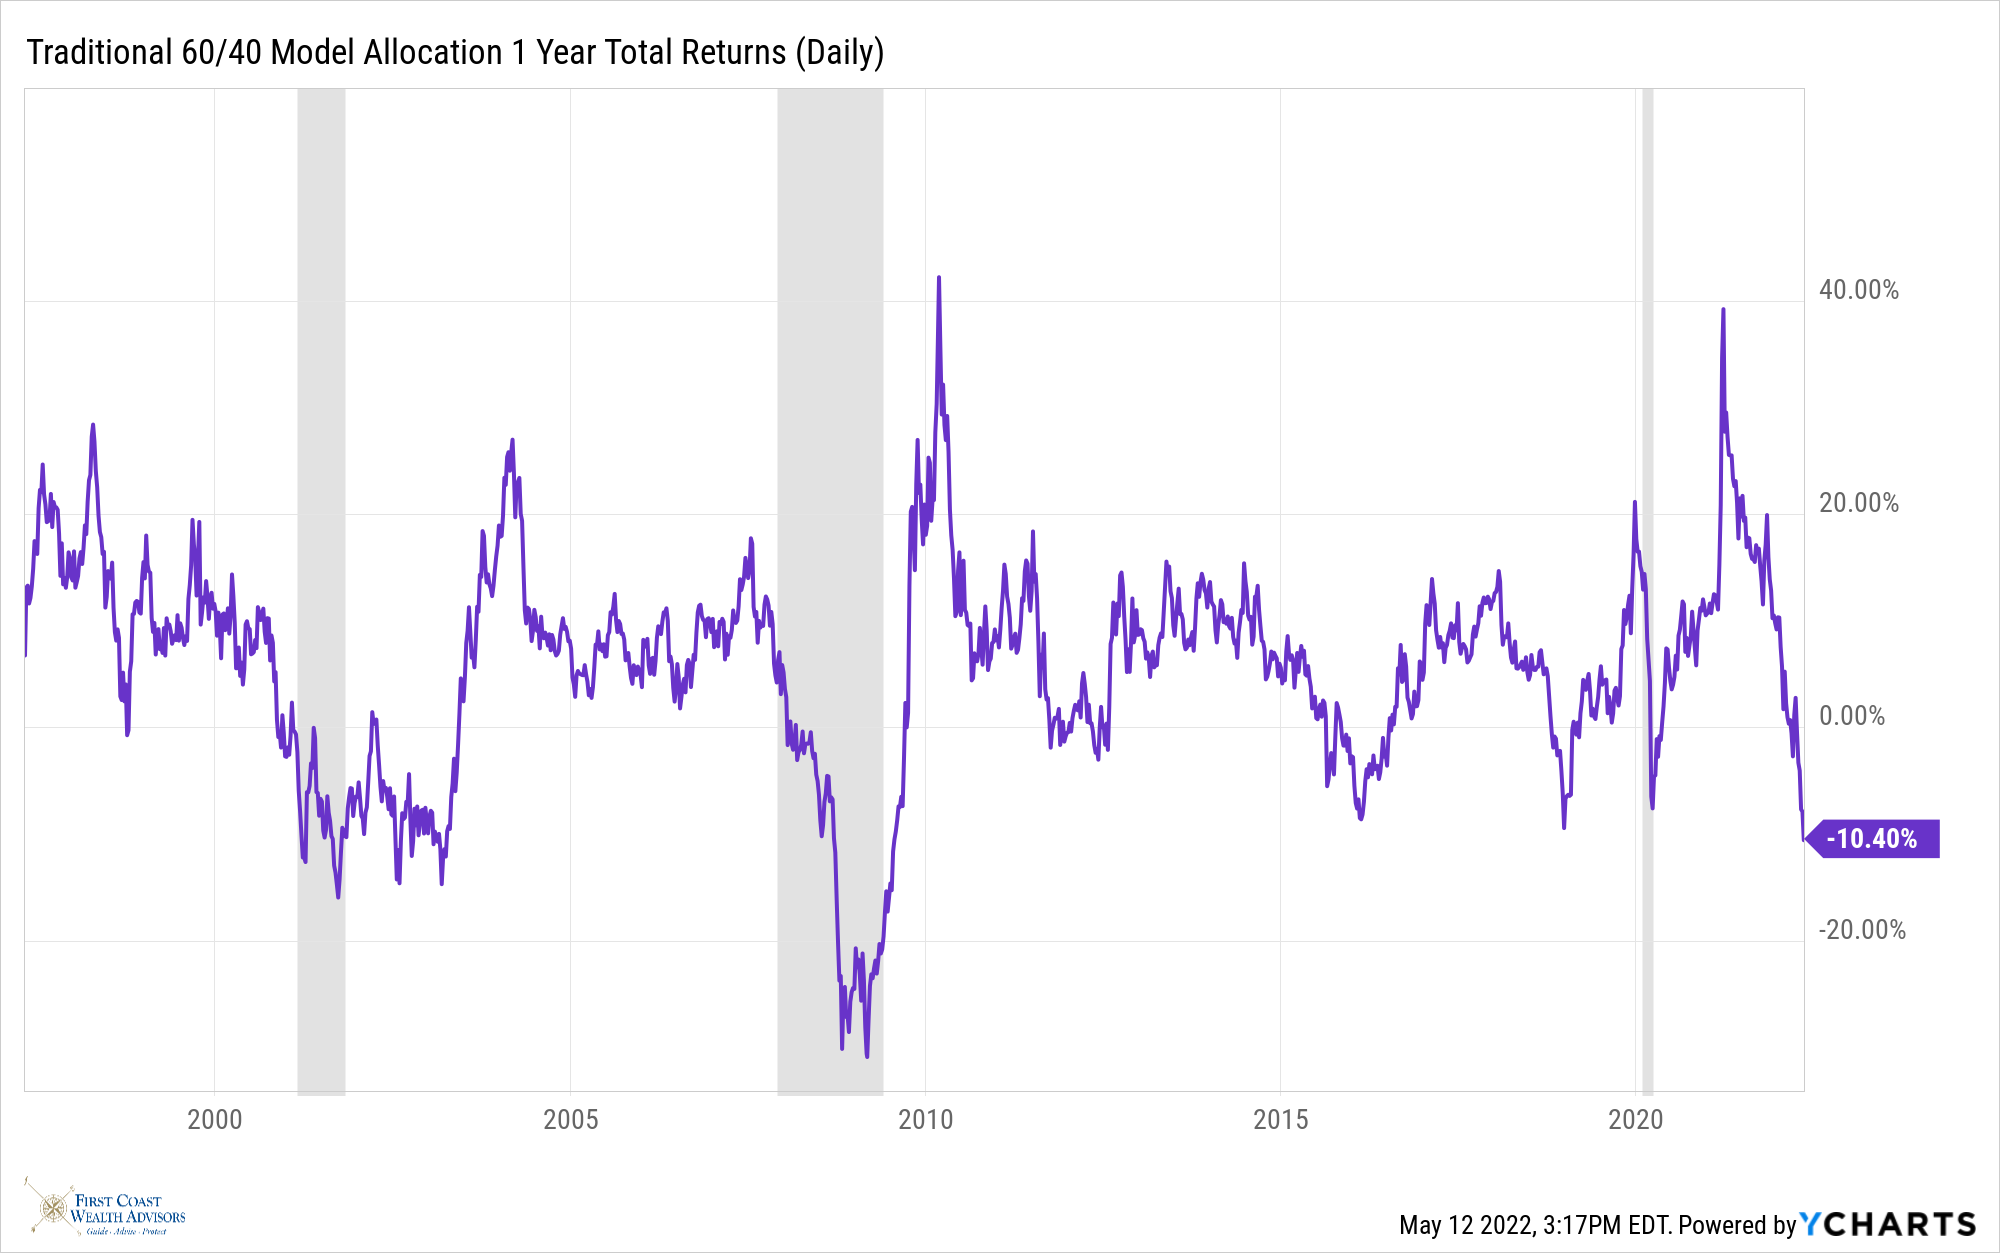
Our data goes back to April 28th, 1997. There have been six periods, about 24 percent of the time, during which a moderate growth portfolio endured negative annual returns. Aside from the Covid experience of 2020, the last time this happened was at the beginning of 2019.
The average drawdown during these six periods is 7.8 percent. As of May 12th, the moderate growth allocation was down 10.4 percent, slightly worse than average.
The average length of time those six periods lasted is 11 months, but that is skewed by the 31 months from 2000 to 2003. We’re only a month into this one.
What does this mean? In our opinion, the market has accelerated its pullback and compressed it into a shorter period. It may take a while to come out of the hole, but we think the worst of it is behind us.
Once the trough has come in, the historical average return for the next twelve months is a positive 17.5 percent.
Regardless of whether you look at it from a calendar or rolling year basis, the odds are pretty high that you’ll have gotten your money back a year from now. You have to be patient and disciplined.
How else should I be thinking about this pullback?
We haven’t received many calls from clients, but the ones we have were all about how this pullback affects their financial plan. The great thing about having a financial plan is that they incorporate these temporary declines into their forecasts. We don’t know when they will manifest, just that they will come about from time to time. By including this randomness into the forecast, the plan accounts for them. If your plan says you were on track and in a good place six months ago, odds are you still are.
If you don’t have a financial plan, or it’s been a while since you checked in on it, we’re happy to talk with you about it.
Drawdowns like the one we are experiencing offer buying opportunities. The financial markets are perpetually upward sloping, but sometimes they are punctuated with temporary pullbacks. If you are like us and in the accumulation phase of life, you should view these periods as opportunities. You have the chance to buy good quality investments on sale. When the recovery begins, having more quantity will amplify your returns.
For those of you taking regular withdrawals from your accounts, don’t let the market’s behavior cloud your judgment. A typical income plan incorporates periodic fluctuations into the mix. And if you have a financial plan, you will likely see no change in your outcome. Again, if you would like to review your plan, please let us know.
Okay, the word count is rising, so I’ll close with this. Since January, Jeff and I have been warning that investors should expect more modest returns this year after having experienced three solid previous years. We didn’t expect this year to be so challenging, but what we are going through is not unusual. The statistics lead us to believe the worst is behind us, but it could take more time before a sustainable recovery begins. We encourage you to be patient, embrace the opportunity, and find something fulfilling to focus your attention on.
If you missed our webcast back in April, you can watch a replay here.
Until next time,
i The S&P 500 index is an unmanaged market cap weighted index of the 500 largest companies in the U.S. It is owned by Standard and Poors. You cannot direct purchase the index. Data throughout this article, including data used in the creation of charts is courtesy of Ycharts.com.
ii U.S. stocks are represented by the Russell 3000 index which is a market cap weighted index of the 3,000 largest stocks in the country. International stocks are represented by the MSCI All Country World Index excluding the USA. This index is a market cap weighted index of global stocks excluding stocks listed in the USA. Investment grade bonds are represented by the Bloomberg US Aggregate bond index. This is an index of investment grade corporate bonds along with bonds issued by the U.S. federal government. Direct purchase of an index is not possible. Performance assumes annual rebalancing and reinvestment of investment income.