
As of today (July 14th), the U.S. stock market* is down a little more than 20 percent from its all-time high, having entered a bear market precisely one month ago. Bonds* are not faring well either, and they are down about 10 percent since the start of the year. Both asset classes are down for the same reasons: rising interest rates to combat record levels of inflation and uncertainty over how corporate profits will be affected by these higher costs. The economy is also starting to show signs of slowing its rapid pace of growth which has stoked fears of an impending recession.
This has resulted in diversified portfolios being down about 12 percent over the past twelve months. Not a fun place to be and begs the question, where do we go from here?
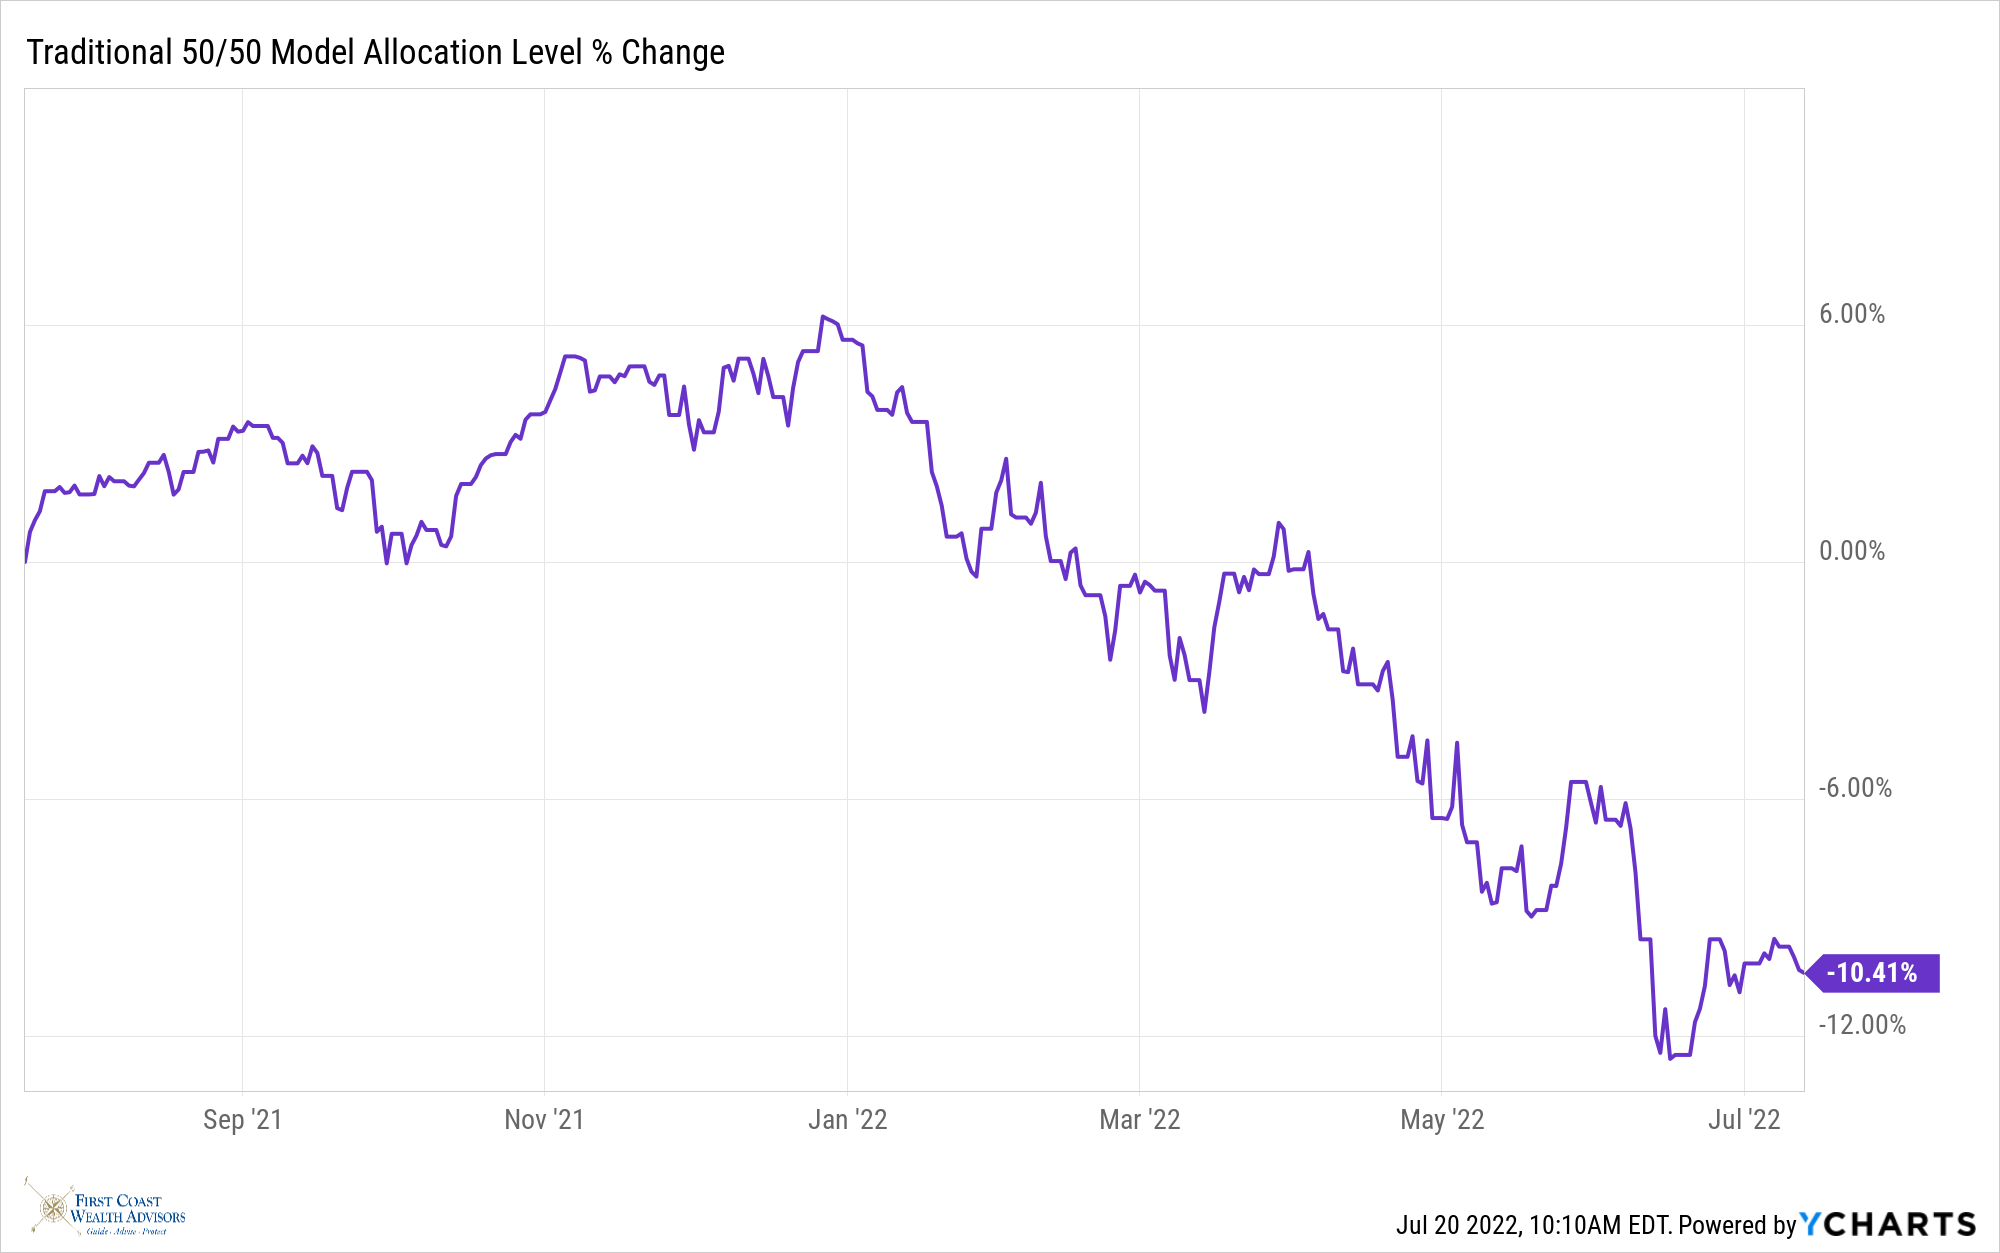
The above chart summarizes the return of a hypothetical portfolio consisting of 50 percent S&P 500 stock index and 50 percent Bloomberg US Aggregate bond index over the past twelve months. While we can not directly invest in an index, this is a good representation of an average investor allocation.
Two of my responsibilities as a financial adviser are making sense of the markets and setting client expectations. So, when markets behave as they have, I ask questions: is this behavior normal, how long will it last, and what usually happens next?
Let’s look at how a balanced portfolio has behaved over time.
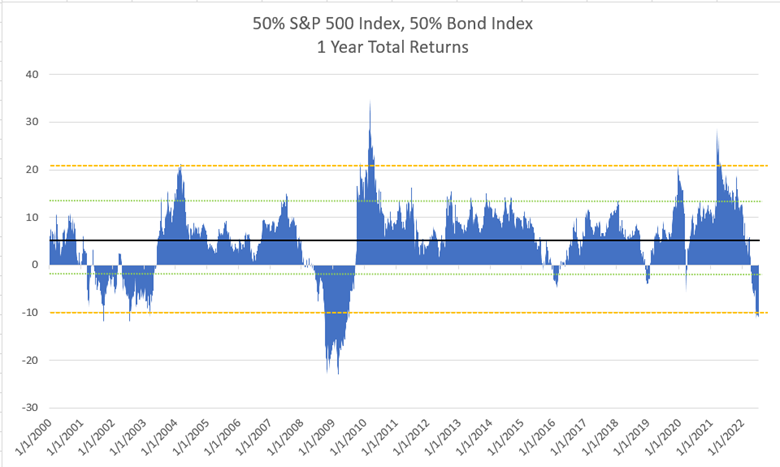
This chart plots rolling twelve-month returns back to January 2000. We use rolling twelve-month periods rather than calendar years because it gives a better picture of how returns unfold over time.
The average twelve-month return comes to 5.6 percent. That’s the black line on the graph. As you can see, most annual returns fall between a low of -2 and a high of 13 percent. Occasionally, and rarely, returns will cross the -10 percent line. And that is where we are today. This hypothetical portfolio is down 11.2 percent over the past year.
Question 1: Is this experience normal? No, the return over the past year is not normal, but it is also not unusual. Fortunately, this type of return is rare and only happens when a very high degree of uncertainty over corporate profits is present. Just how rare? Less than 3% of the time. From 2001 to 2003, uncertainty was due to the bursting of the Tech Bubble, 9/11, and the invasion of Iraq. In 2008 it was the Financial Crisis. Today we have the bursting of the Covid Bubble, the Fed tightening monetary policy to fight inflation, and a war in Europe.
Question 2: How long do returns stay at this level? Returns tend to normalize within 6 to 12 months of turning negative. The catalyst for that has always been when the Fed either stops raising interest rates or reduces them. The Federal Reserve is committed to raising rates through the remainder of this year to fight inflation, but the consensus of market participants is that they will stop raising them in January. Time will tell.
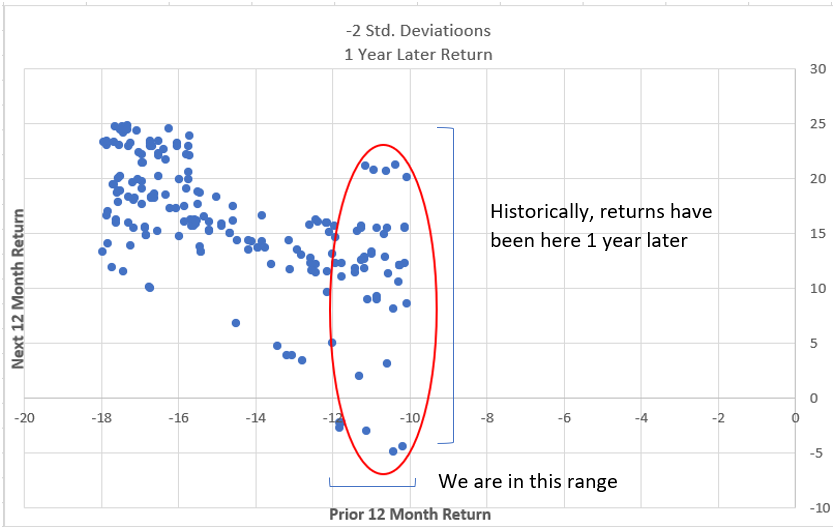
Question 3: What happens when returns have been at this level before? The average return over the next twelve months is 15.6 percent. Returns can be negative one year later, but the overwhelming majority of the time, they are positive. To make a finer point, the worse returns have been over the past twelve months, the better they are over the next twelve. The following chart demonstrates this relationship and highlights how returns fared when they were near their current level.
Now that these questions have been answered, we can start to address the next logical question: do I need to do something different with my portfolio? No. When developing projections for long-term success, financial planning forecasts incorporate years like this. We have not seen the status of anyone’s financial plan change because of the pullback in returns. Besides, becoming more conservative with your portfolio at this point will delay the eventual recovery.
There are two things you should be considering.
First, if you are still contributing to your investments, now is the time to step up your investing. The temporary decline has created the “buy low” opportunity you should look for. Investments made today will enjoy the recovery when it happens and help enhance returns over the long run.
Second, if you are willing to increase your risk tolerance, now is the time to reallocate your portfolio toward more exposure to growth (stocks). This could lead to a faster recovery and improve your long-term average return.
Wrapping this article up, the past 30 months have been extraordinary. COVID, inflation, rising rates, Russia/Ukraine, and the upcoming midterm elections are all uncertainties. And markets hate uncertainty. But most of these issues will be much clearer as the rest of this year progresses. Markets love clarity. History as a guide shows us the odds are in our favor to recoup most if not all of today’s declines over the next twelve months or so. We’ll take those odds. We’ve said it before and we’ll say it again: Markets have always recovered – we just don’t know exactly when it starts or how long it takes. But we do know everyone will want to be on that train.
The S&P 500 index is an unmanaged market-cap-weighted index of the 500 largest companies in the U.S. It is owned by Standard and Poors. You cannot directly purchase the index. The Bloomberg US Aggregate Bond Index is a broad-based flagship benchmark that measures the investment grade, US dollar-denominated, fixed-rate taxable bond market. The index includes Treasuries, government-related and corporate securities, MBS (agency fixed-rate pass-throughs), ABS and CMBS (agency and non-agency). Data throughout this article, including data used in the creation of charts is courtesy of Ycharts.com.